

When looking at most metric charts, seeing a hockey stick chart represents an uptick in numbers and an overall positive outcome.
Well, the Average Personalization chart found in your Email Analytics acts a little different. The goal of the chart is to make sure the best reply rate and most emails delivered are in the same bucket. This means you are comparing those two bars with each other rather than looking for your averages to skew left or right.
You need to interpret the data being shown. Fortunately, we've prepared four types of charts to teach you how to read the data you see.
Nada: No Personalization
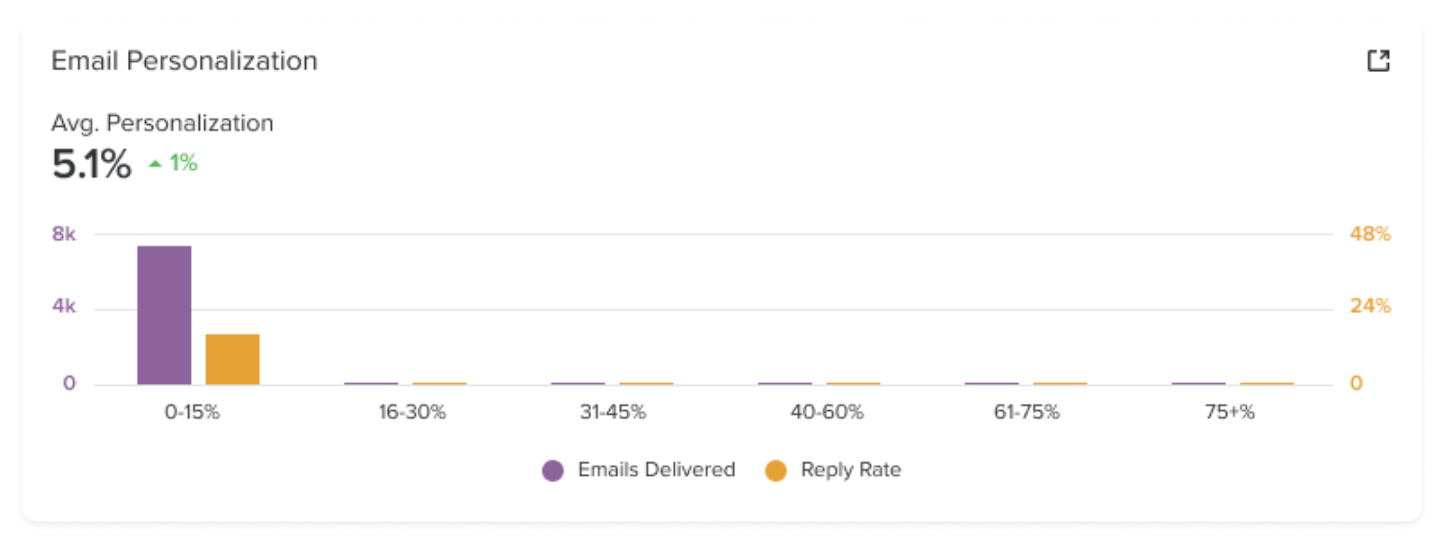
What this chart says…
- Based on the bucket, all emails have less than 15% personalization.
- This means you're seeing low overall personalization.
- There's also a low reply rate.
- Conclusion: Need to personalize more than 5% to see improved reply rates.
Need Less: Diminishing Returns
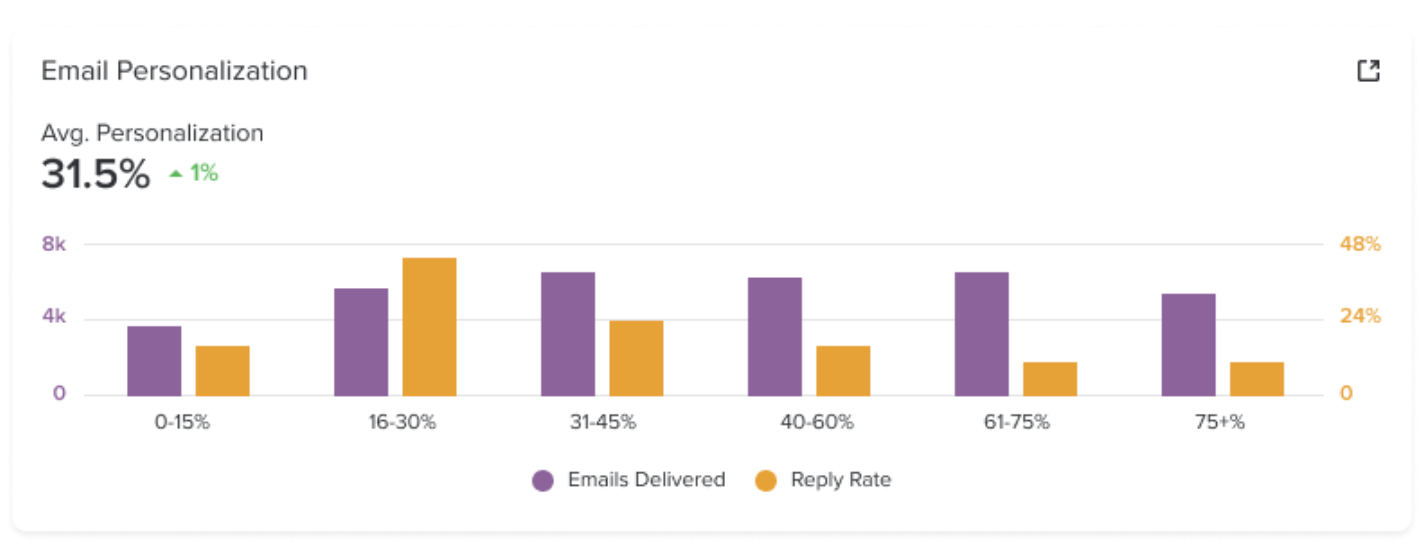
What this chart says…
- The best reply rate, 10%, is when personalization is 16-30%.
- Most emails are sent with 31-45% personalization.
- Conclusion: Since the best reply rate occurs with a lower personalization rate, you might be doing too much personalization.
Not Working: Less is More
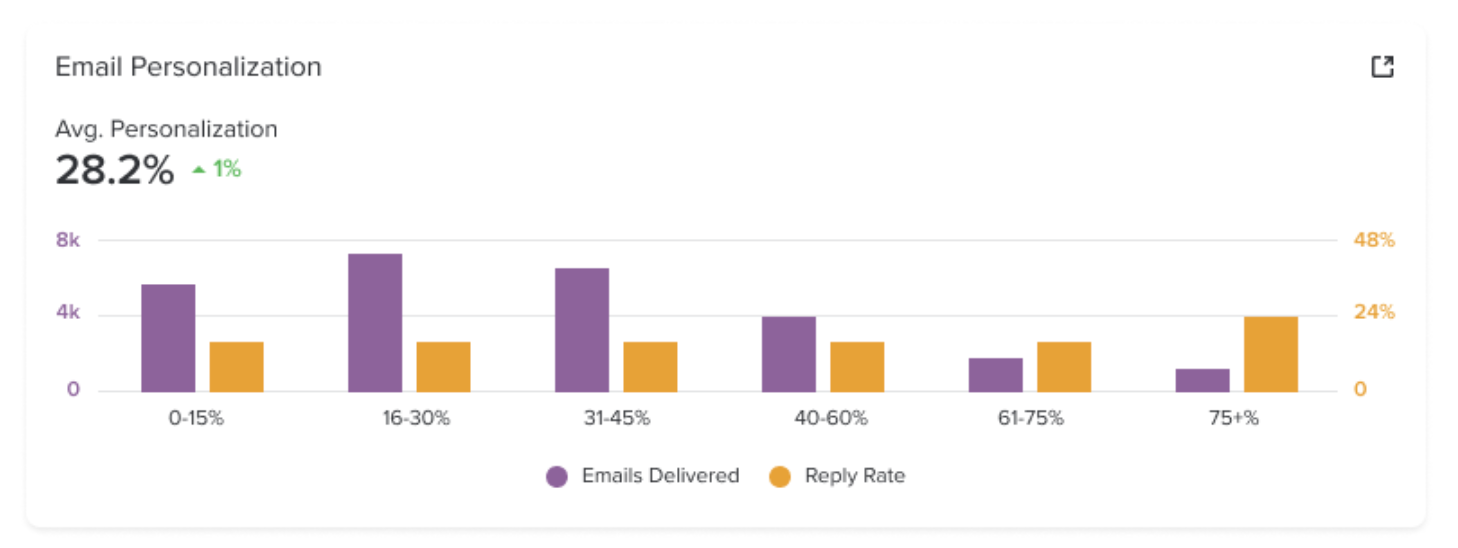
What this chart says…
- Doing lots of personalization with emails in every category.
- Conclusion: Personalization isn’t working because the reply rate is the same no matter how much you do.
Nirvana: Ideal Chart
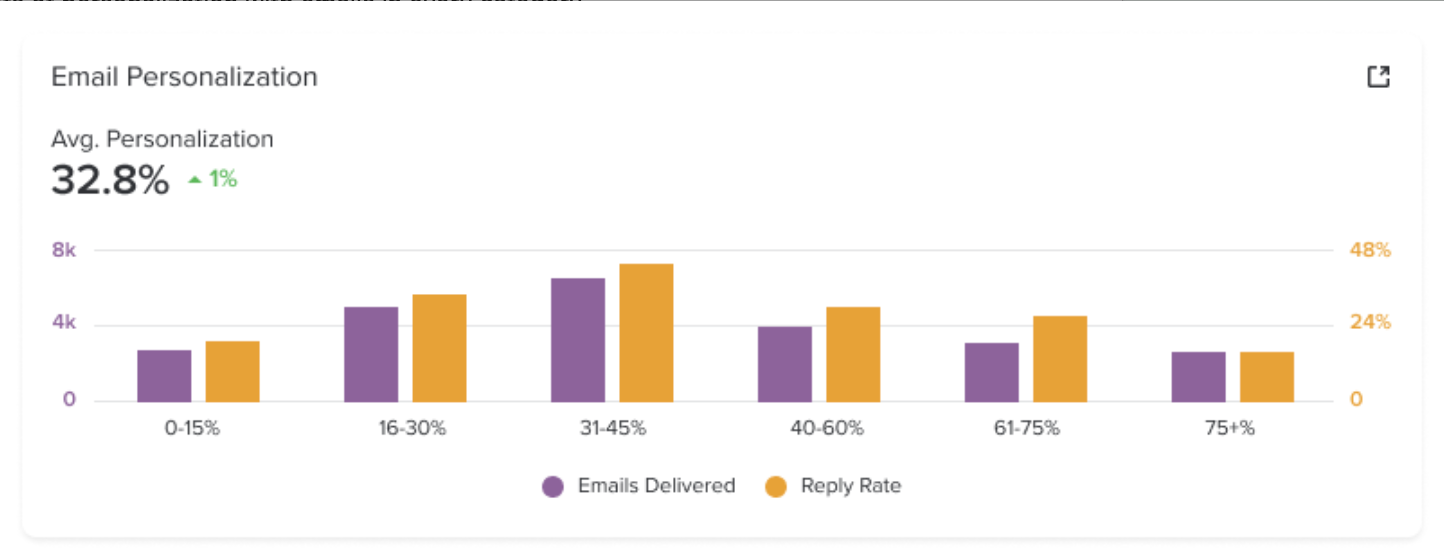
What this chart says…
- Personalizing between 31-45%.
- Your highest reply rate occurs in the bucket where you send the majority of your emails.
- Conclusion: Keep doing what you’re doing!
Personalization and Email Coaching Opportunities
Using the Personalization metrics, you can gauge whether a user should use more or less personalization in their emails. But there is a difference between reps changing a couple sentences to boost their personalization score and sending a quality, personalized email. The latter has a greater chance of receiving a reply.
Keeping that in mind, here are some tips managers should keep in mind while coaching reps to improve the quality of their personalization:
- Add content that is unique to the individual. Adding details you may share in common like if you:
- attended the same college
- previously worked at the same company
- know people in common
- Align the message to the buyers’ unique challenges. Position the message with specific knowledge of the buyer’s pain points.
- Focus on the Account or company-based information, highlighting the specific company that the buyer represents
- Use a persona-based approach. This will position the role of the buyer.
- Personalize based on where the buyer is in sales cycle.